
Configuring Performance Graphs
To add a graph
-
On the Performance tab, select Actions and then New Graph. The New Graph dialog box is displayed.
-
Enter a name for the graph in the Name field.
-
From the list of datasources, check the check boxes for the datasources you want to include in the graph.
-
Click Save.
To edit a graph
-
Navigate to the Performance tab and select the graph that you would like to edit.
-
Select Actions and then Edit Graph.
-
On the graph details window, make the necessary changes and click OK.
To delete a graph
-
Select the graph to remove from the list of graphs displayed on the Performance tab.
-
Select Actions and then Delete Graph.
-
Click Yes to confirm the deletion.
To reorder a graph
-
Navigate to the Performance tab and select the graph that you would like to reorder.
-
Select the Move Up or Move Down tab to move the graph from its current location.
To change datasource color in graphs
-
Navigate to the Performance tab.
-
Double-click on the graph for which you want to change the color of the datasource. The graph details dialog box is displayed.
-
Check the colored check box located against the required datasource and choose a new color from the color picker.
-
Click OK to confirm.
To Change the graph type
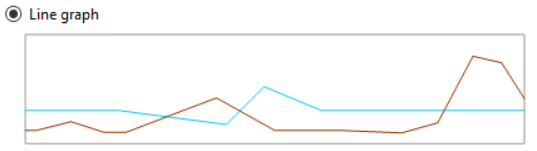
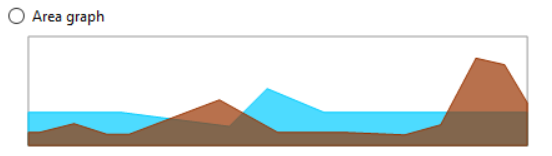
Data on the performance graphs can be displayed as lines or as areas:
Line Graph:
Area Graph:
To change the graph type:
-
On the Tools menu, select Options and then select the Graphs tab.
-
To view performance data as a line graph, choose the Line graph radio button.
-
To view performance data as an area graph, choose the Area graph radio button.
-
Click OK to save your changes.