
Monitoring host and dom0 resources with NRPE
Note:
The NRPE feature is available for XenServer Premium or Trial Edition customers. For more information about XenServer licensing, see Licensing. To upgrade, or to get a XenServer license, visit the XenServer website.
Users with the Pool Admin role can use any third-party monitoring tool that supports the Nagios Remote Plugin Executor (NRPE) to monitor resources consumed by your XenServer® host and dom0 - the control domain of your host.
You can use the following check plugins to monitor host and dom0 resources:
| Metric | NRPE check name | Description | Default warning threshold | Default critical threshold | Performance data returned |
|---|---|---|---|---|---|
| Host CPU Load | check_host_load | Gets and checks the current load per physical CPU of the host, where load refers to the number of vCPU(s) in a running or runnable state. | 3 | 4 | Current system load of the CPU of the host (calculated by taking the average load of the physical CPU of the host). |
| Host CPU Usage (%) | check_host_cpu | Gets and checks the current average overall CPU usage of the host. | 80% | 90% | The percentage of host CPU that is currently free and the percentage that is in use. |
| Host Memory Usage (%) | check_host_memory | Gets and checks the current memory usage of the host. | 80% | 90% | The percentage of host memory that is currently free and the percentage that is in use. |
| Host vGPU Usage (%) | check_vgpu | Gets and checks all the current running Nvidia vGPU usage of the host. | 80% | 90% | The percentage of running vGPU that is currently free and the percentage that is in use. |
| Host vGPU Memory Usage (%) | check_vgpu_memory | Gets and checks all the current running Nvidia vGPU memory usage (including the shared memory and graphic memory) of the host. | 80% | 90% | The percentage of running vGPU memory (including the shared memory and graphic memory) that is currently free and the percentage that is in use. |
| Dom0 CPU Load | check_load | Gets and checks the current system load average per CPU of dom0, where load refers to the number of processes in a running or runnable state. | 2.7,2.6,2.5 | 3.2,3.1,3 | Host CPU load data calculated by taking the average of the last 1, 5, and 15 minutes. |
| Dom0 CPU Usage (%) | check_cpu | Gets and checks the current average overall CPU usage of dom0. | 80% | 90% | The average overall CPU usage of dom0 as a percentage. |
| Dom0 Memory Usage (%) | check_memory | Gets and checks the current memory usage of dom0. | 80% | 90% | The percentage of dom0 memory that is currently free and the percentage that is in use. |
| Dom0 Free Swap (%) | check_swap | Gets and checks the current swap usage of dom0. | 20% | 10% | The percentage of MB on dom0 that is currently free. |
| Dom0 Root Partition Free Space (%) | check_disk_root | Gets and checks the current root partition usage of dom0. | 20% | 10% | The percentage of MB on the dom0 root partition that is currently free. |
| Dom0 Log Partition Free Space (%) | check_disk_log | Gets and checks the current log partition usage of dom0. | 20% | 10% | The percentage of MB on the dom0 log partition that is currently free. |
| Toolstack Status | check_xapi | Gets and checks the status of the XenServer management toolstack (also known as XAPI). | XAPI elapsed uptime in seconds. | ||
| Multipath Status | check_multipath | Gets and checks the status of the storage paths. | The status of the storage paths. OK indicates that all paths are active, WARNING indicates that some paths have failed but more than one path is active, CRITICAL indicates that there is only one path active or that all paths have failed, UNKNOWN indicates that host multipathing is disabled and that the status of the paths cannot be fetched. |
NRPE is an on-premises service that runs in dom0 and listens on TCP port (default) 5666 for check execution requests from a monitoring tool. After a request arrives, NRPE parses it, finds the corresponding check command including the parameter's details from the configuration file, and then runs it. The result of the check is sent to the monitoring tool, which stores the results of past checks and provides a graph showing the historical performance data.
Prerequisites
To be able to use NRPE to monitor host and dom0 resources, the monitoring tool you are using must meet the following prerequisites:
-
The monitoring tool must be compatible with NRPE version 4.1.0.
-
To allow communication between NRPE and the monitoring tool, the monitoring tool must support TLS 1.2 with ciphers
ECDHE-RSA-AES256-GCM-SHA384andECDHE-RSA-AES128-GCM-SHA256, and the EC curve issecp384r1.
Constraints
-
You can configure NRPE settings for an entire pool or for a standalone host that is not part of a pool. Currently, you cannot configure NRPE settings for an individual host in a pool.
-
If you add a host to a pool that already has NRPE enabled and configured on it, XenCenter® does not automatically apply the pool's NRPE settings to the new host. You must reconfigure NRPE settings on the pool after adding the new host or configure the new host with same NRPE settings before adding it to the pool.Note:When reconfiguring NRPE settings on a pool after adding a new host, ensure the host is up and running.
-
If a host is removed from a pool with NRPE enabled and configured on it, XenCenter does not alter the NRPE settings on the host or the pool.
Configure NRPE by using XenCenter
You can configure NRPE by using XenCenter or the xe CLI. For more information on how to configure NRPE by using the xe CLI, see Configure NRPE by using the xe CLI.
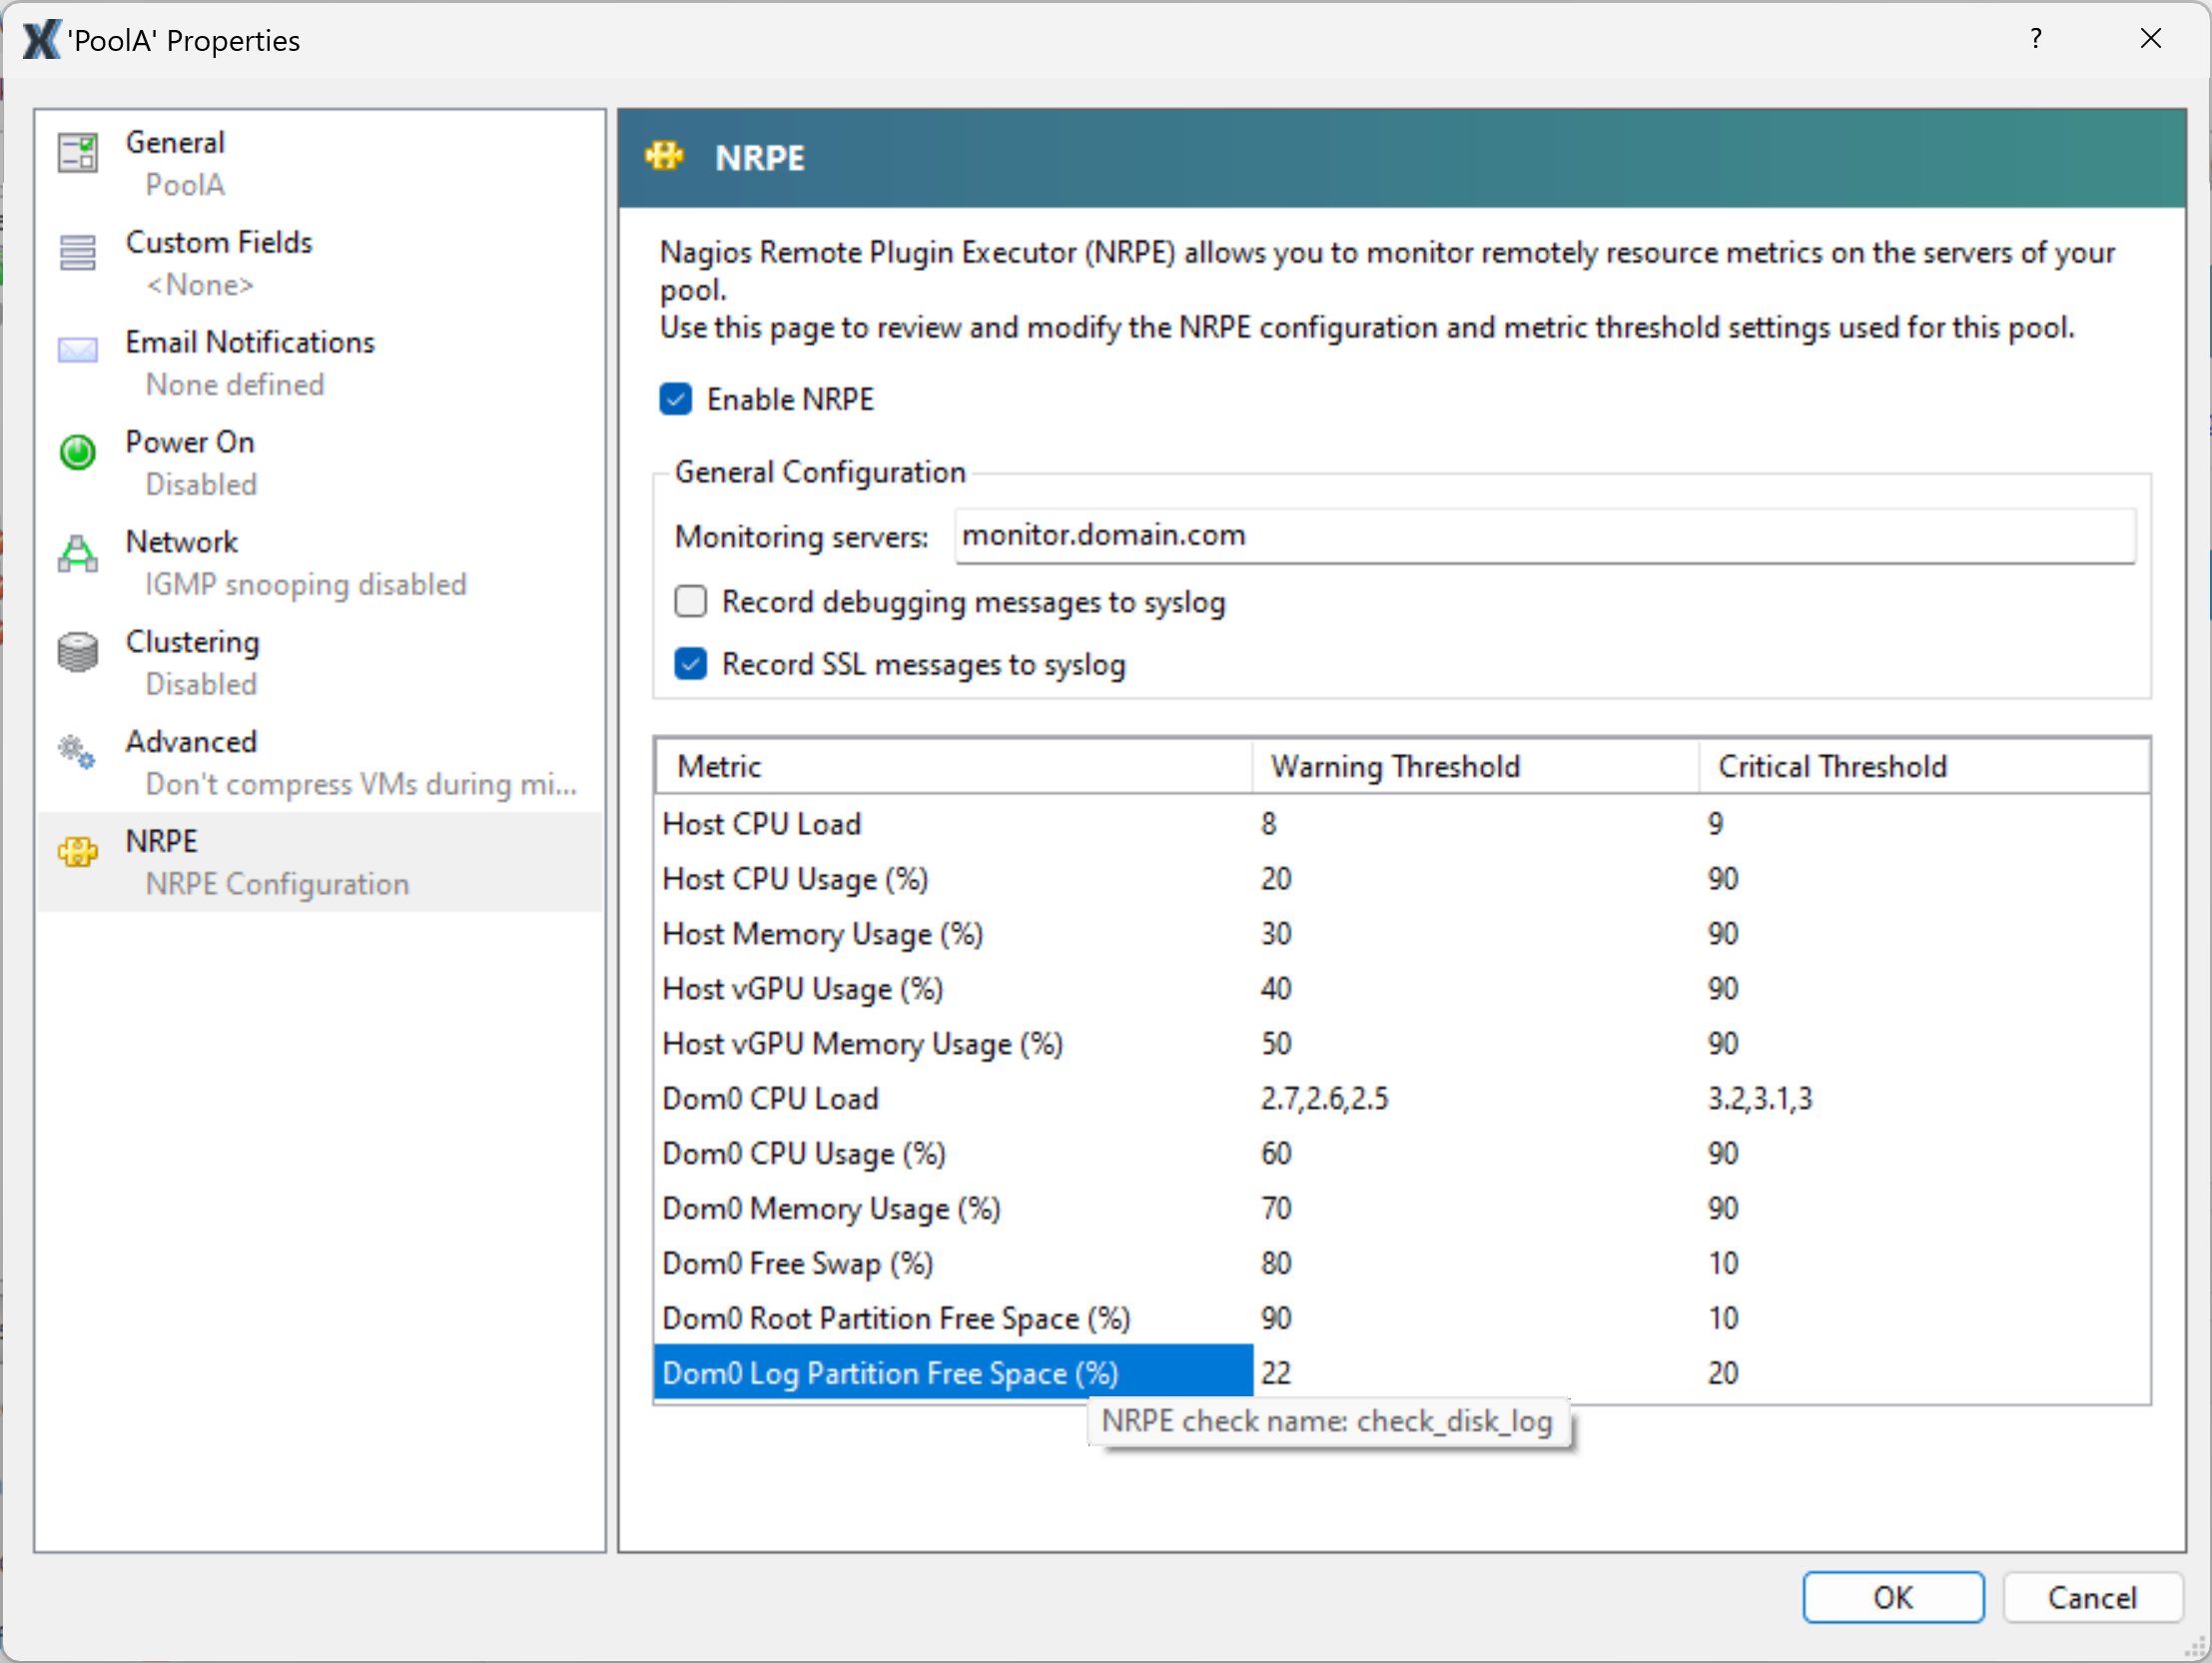
To configure NRPE for a standalone host or for an entire pool, go to the NRPE Configuration tab on the Properties dialog for your host/pool and follow these steps:
Note:
When configuring NRPE for a pool, the NRPE Configuration tab displays the default NRPE configuration values for the entire pool.
-
In the Infrastructure view, choose the host/pool that you want to configure NRPE settings for.
-
In the General tab, click Properties.
-
In the Properties dialog, select the NRPE tab.
-
Select the Enable NRPE check box.
-
To add more monitoring servers that are allowed to talk to the NRPE daemon, specify the hosts as a comma-delimited list of IP addresses or host names. They can be specified in the following formats:
-
IP address (only supports IPv4)
-
Classless Inter-Domain Routing (CIDR) (format:
xxx.xxx.xxx.xxx/n, for example,192.168.1.0/24) -
Host name
-
-
To enable debug logging, select the Record debugging messages to syslog check box.
-
To enable SSL logging, select the Record SSL message to syslog check box.
-
(Optional) Adjust the warning and critical thresholds by modifying the values in the warning and critical thresholds table.For some check plugins, you can set warning and critical threshold values so that if the value returned by a check plugin exceeds the threshold values, an alert is generated. The warning threshold indicates a potential issue and the critical threshold indicates a more serious issue that requires immediate attention. Although default values are set for the warning and critical thresholds, you can adjust the threshold values.
-
Click OK to apply any configuration changes to your host/pool.
Related documentation
XenServer Current Release
-
Monitor host and dom0 resources with NRPE